The horizon seems in many ways to be the dominant feature of maritime art, seperating sea from sky, and demarcating at the same time the bounds and boundlessness of possibility. Can we use our data to confirm this intuition? How does the horizon manifest in the viewing behavior of naive participants viewing these paintings (seascapes and shipscapes alike) for the first time?
The Horizon in 3D
The following is the same type of plot introduced in the previous section, but this time showing the aggregate pattern of fixations across all the seascapes. The predominant ‘ridgeline’ you see here are the fixations that cluster around the horizon: the central, unifying feature across all the seascapes. The second, lower ridgeline is most likely the result of fixations drawn to the foreground or beach.
For grounding, consider the aggregate pattern of fixations on the seascapes (cyan) against the aggregate pattern of fixations on the shipscapes (salmon). Notice that the horizon in the shipscapes is shifted a bit more towards the foreground, but that the falloff in fixations towards the sky is far more gradual and peripheral than in the seascapes – the obvious result of there being a subject (the ship) that now dominates what in the seascape is simply sky.
The Horizon as a Region of Interest
We can confirm some of the intuitions afforded by these visualizations with a ‘region-of-interest’ analysis, cordoning off the area of the canvas directly on and around the horizon and tracking the relative quantity of fixations in that region.
As an example, we’ll use Kennsett’s Sunset on the Sea.

In the following graph, every dot corresponds to one fixation from one subject (and with over 125 subjects, there’s quite a lot of them). The translucent salmon bar is the area we’ve defined as the region of interest. The opaque salmon dots are the dots that fall within our region of interest.
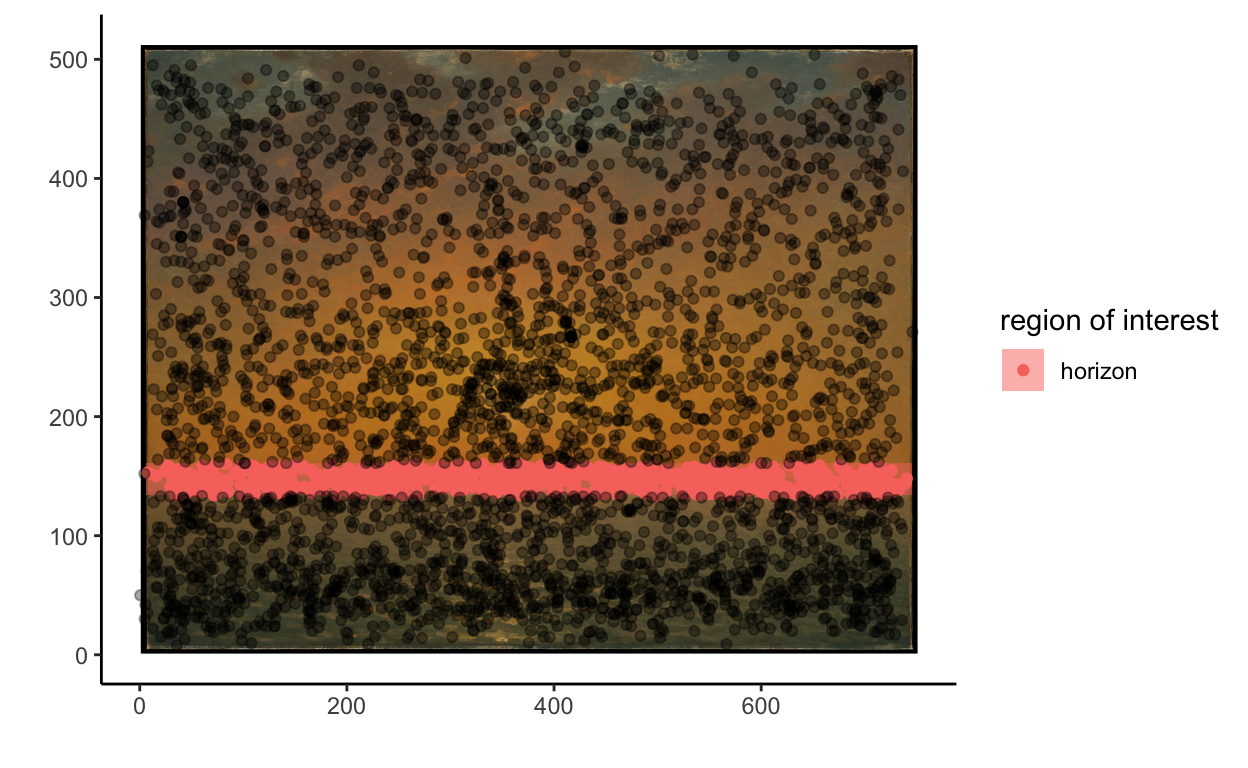
Perhaps one of the more intuitive statistics we can glean from our region of interests analysis is the relative density of fixations within a region versus the rest of the canvas. We calculate this by comparing two proportions: the total quantity of fixations across the whole canvas divided by the total area of the canvas; and the quantity of fixations that land within the region of interest divided by the area of the canvas that region of interest covers. If our region of interest really is all that interesting, it means that there should be a greater density of fixations within that region than across the canvas at large. The relative increase in the density of fixations can be expressed as a percentage. For example, the relative increase in the density of fixations across the region of interest for the horizon in our example image is 259% – meaning that for the area of canvas it covers, the horizon proportionally attracts over two and half times more fixations than the canvas at large. This is a pretty substantial increase (and one whose significance we can further confirm by a permutation testing strategy wherein we assess the density of fixations in randomly defined regions of interest of the same size as our target). For 15 / 15 seascapes, we see concordant increases, with average increase in relative density of fixation at 321%, and an upper bound of 433%.
Another statistic we can extract is the average timing of fixations on the horizon. Here, we tend to see that the horizon is (at least, for 10 / 15 seascapes) in the first 3rd of all fixations made per subject – and thus tends to be one of the earliest landmarks that draw a viewer’s attention. (The only other discernible landmarks that tend to draw the viewer’s gaze any sooner are foreground, beachbound items of high contrast.)
All in all, these datapoints confirm what our eyeballing and intuition most likely made amply clear: the horizon is most definitely one of, if not the most, salient feature of the seascapes.